Thursday, December 29, 2016

Family Tree Maker "Web Links"

Family Tree Maker has a Web Links feature:

Family Tree Maker Web Links

Although FTM does not appear to publish these Web Links at the present time, Charting Companion (6.4.39 and later) can display the Web Links in any chart or report that allows selection of event types.

You can display Web Links in the Standard Family Group Record:

Web Links in Family Group Record

You can display Web Links in any chart. Note that if you Publish as HTML, the Web Links are "hot" or clickable. Clicking on them will open a new browser tab to the Website. Facebook, Linked In, Twitter and Google+ links are highlighted with a special button. Click for true HTML page.

Chart with "clickable" links

You can display Web Links in an Ancestor or Descendant Book:

Web Links in Ancestor or Descendant Book

You can display Web Links in the Outline Descendant:

Web Links in Outline Descendant
When creating a chart, make sure that the "WebLink" event type is included in the list of events, and that "Place Names" is checked:


To click the links in Internet Explorer, click on "Allow blocked content".

Thursday, November 3, 2016

Genelines: Genealogy timelines

Genelines - Timeline Charting Software
 
GENELINES is one of the most powerful research and storytelling tools available to anyone researching their family tree.
 
By bringing together elements of time, history and family relationships on visual time line charts, Genelines (for Windows) software can bring your family tree to life.

Genelines automatically reads your family tree database so you don't need to re-enter your family information. For a complete list of compatible family tree database programs, click here.

Your choice of CD-ROM or Download!
http://progenygenealogy.com/products/timeline-charts/universal-version.aspx


CREATE AMAZING TIMELINE CHARTS
 
Genelines features a suite of seven different timeline chart formats, consisting of two BIOGRAPHICAL and five RELATIONSHIP charts.

Each of these seven charts can be customized according to: timeline, historical events, personal or family events, colors and fonts.  

Unique in presentation, the Individual and Comparative Biographical Charts allow you to include such events as career path, relationships, place of residence, etc., and compare these life experiences with those of other relatives in your database.

You can even add historical events that were happening at different times during their lives to see how such events may have impacted the decisions they made and the directions they went.

The Relationship charts let you view your family pedigrees and lines of descent against a backdrop of historical events on the local, regional or world stage.

You can customize charts according to people, line of descent or family group, personal life details, color, and the history you wish to depict.

The relationship charts can explain a great deal about your family and how they lived and even allow you to add people who are not necessarily related.


FLEXIBLE PRINTING OPTIONS
 

All Genelines charts can be previewed and printed in full color, in various sizes - including wall charts - or published to PDF and incorporated into a web page or shared by e-mail. The Genelines form of presentation can be much more meaningful and easier to understand than a typical text based report, and can help you draw conclusions that may otherwise have been missed.
 
GET YOURS TODAY
 
Genelines, a program that will help you:
- produce amazing timeline charts
- identify missing information
- highlight illogical or contradictory data
- expose duplicate persons
- focus your research
- assist with data collection
- help you understand your data better

An unbelievable program at an unbelievable price of $29.95 (Download) / $34.95 (CD-ROM).

For more information on Genelines, sample charts and research examples go to: http://progenygenealogy.com/products/timeline-charts.aspx

For more information on ordering your copy of Genelines 2.4 go to:
http://progenygenealogy.com/products/timeline-charts/universal-version.aspx
 
Such a valuable program at such a great price, now is the time to make it a part of your genealogy software library.

Pierre 120.jpg
Pierre Clouthier
President, Progeny Genealogy Inc.

Sunday, September 18, 2016

Descendant "Bottom-up", "No spouse"; saving chart as spreadsheet; videos

CHARTING COMPANION - NEW FEATURES

Children can be so wonderfully direct. We were at a parade, and my four-year old Melanie says "Give me a piggyback!"
 
"I'm tired" I replied.
 
"I'm not!"
 
 
We have recently added some enhancements to Charting Companion.
 
Descendant "Bottom-up"
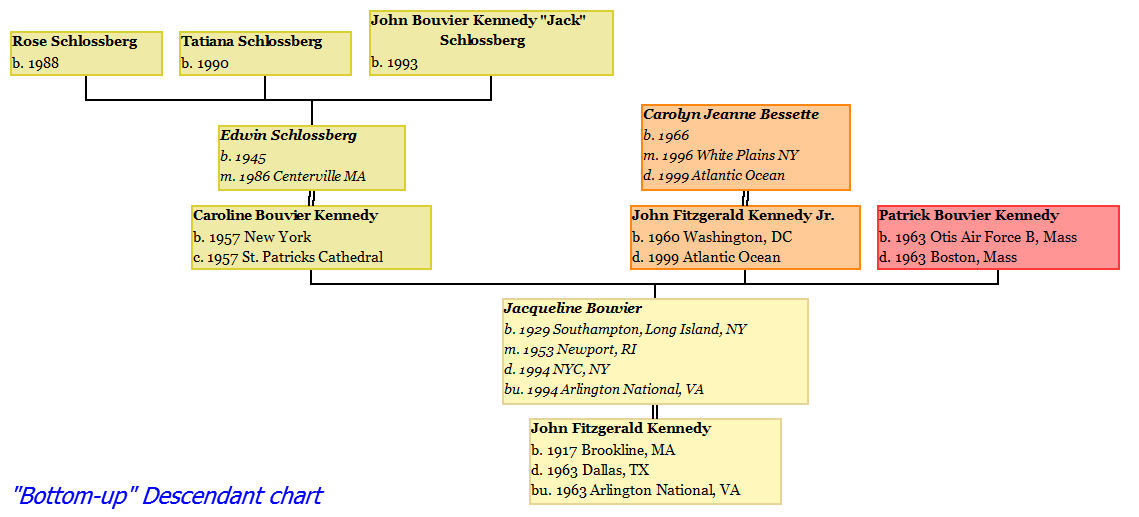
Charting Companion can now display a Descendant chart in "Bottom-up" mode, with the Subject at the bottom, and the descendants above, like a growing tree with its branches rising upwards.
 
Interesting Image
 
The Descendant chart also has a "no spouse" option, where the spouses are not displayed, and only the bloodline relatives appear.
 
Save chart as a spreadsheet.
Ancestor and Descendant charts can be published as an Excel spreadsheet. Birth, Marriage and Death dates & places, for everyone in the chart, are saved in the spreadsheet file.
 
The results of a Search can also be saved as a spreadsheet, complete with a special "sort date" that enables you to see events in a timeline. You can compare a group of people and see the relationship and sequence of their events.
 
Charting Companion videos
Click to see some short videos that show the power of Charting Companion.

Friday, July 22, 2016

The SEO racket: 21st century Snake Oil

Once a month I get a call from a Search Engine Optimization (SEO) firm who stumbled upon one of my Websites. They want to optimize my SEO, improve my Website, increase traffic, yadda yadda. They can be very persistent, calling repeatedly. One outfit (EZ Marketing) impersonated phone numbers so I would not recognize them on call display.

Their proposition is simple: I give them my credit card number, they siphon $500 to $1,000 from my account every month, and in return they'll assign some low-level grunt to learn my business in fifteen minutes, stuff my <meta> tags with keywords they've gleaned, and write generic link bait pages.

The problem is that there is no way of measuring the cost effectiveness of their efforts. It doesn't make sense to spend more money on advertising, than what revenue it generates.

If my sales increase, tadaa! they're successful. If not, too bad so sad, looks like we'll have to do more of the same and thank you for the cash flow.

I have a counter-proposition. I will assign the consultant an Affiliate Code from my e-commerce system. The Affiliate Code will be embedded in the material they create. If their pages generate sales, they will get credit, and a commission. Ditto email.

That usually takes them aback. What? No compensation without performance? We have to measure our results? Heresy!

Like Diogenes, I'm still looking for an honest firm. 

Snake oil, originally a fraudulent liniment without snake extract, has come to refer to any product with questionable or unverifiable quality or benefit.

Monday, July 18, 2016

Charting Companion and the new Family Tree Maker

New Family Tree Maker
Two months after declaring in Dec. 2015 that it would discontinue Family Tree Maker, Ancestry announced that Software MacKiev will be picking up FTM and continue to sell it.
   
We are pleased to announce that Charting Companion continues to be compatible with the new version of Family Tree Maker. Better still, Charting Companion 6.4 appears on the Plugin menu of FTM (click on "Tools, Plugins").
 
.Launching Charting Companion from FTM
 
The new Plugin way to launch Charting Companion offers a seamless and more convenient way for users to create great charts.
 
RootsMagic colors
Charting Companion can now represent RootsMagic colors. If you have assigned colors to persons in your RootsMagic database, they will automatically appear in Charting Companion charts.
  RootsMagic colors
 
 Customer feedback.
We are always interested in customer suggestions to improve our products. While we may not be able to implement them immediately, all suggestions get recorded in our bug/enhancement database.
 
If you have an idea for a new feature, please visit the Charting Companion Feature Request site where you can vote, rank and even fund enhancements. You can register to vote with your social media account, or you can create a new account.

Monday, June 6, 2016

The cruel world of email newsletters

A lot of our revenue comes from sales generated by our newsletters, sent as monthly email.

The newsletters often contain notice of new releases, discounts, etc. stuff that you would think everyone is interested in.

We understand if someone wants to unsubscribe; we readily comply with their request, and never send them email again. Unfortunately, some people's idea of "unsubscribing" is to click on the prominently displayed "Spam" button in many popular email services. This generates a complaint to our own email service. Too many complaints jeopardizes us.

Having spoken with a few customers who "complained" by clicking on the Spam button, it is apparent that people have no idea they are doing this. They believe the Spam button is just a quick, easy way to unsubscribe, instead of clicking the "unsubscribe" link at the bottom of the email. This link is admittedly harder to find.

Here are some typical email menus:

AOL email menu

Hotmail/MSN email menu

Yahoo email menu

As a result of the high rate of (involuntary) complaints, we are forced to withhold email to certain Websites. If you have not been receiving our newsletters and you use Hotmail, MSN, AOL, Yahoo, etc. please send an email to  order@progenygenealogy.com, and we will activate your subscription.

Wednesday, May 11, 2016

PDF: going our own way

Over the years, we've relied on a variety of methods to create charts in the popular PDF (Portable Document Format). Our first choice was PDF-XChange, by Tracker. We had various problems with it. The final straw came when we discovered that Tracker was including a secret payload in their software: a self-contained PDF output driver, to be sold directly and surreptitiously to our customers.

The scam went like this. Companies that make PDF software often have two versions. One is a stand-alone PDF utility that looks like a printer. It is designed so end-users can convert the output of any program into a PDF file, such as MS Word, Excel, etc.

The second version is an SDK (Software Development Kit), aimed at developers, to add PDF capability to their own program. SDK customers are not allowed to create a general-purpose PDF utility, which could be accessed by third-party programs. Fair enough, Tracker make their own PDF output driver for this purpose. It wouldn't be fair to compete with them.

However, Tracker bundled both PDF products into their SDK. We were forbidden from using the stand-alone version, but we still had to incur the overhead and bloat in our installer. Why would they do this? Because as soon as our customer attempted to use the "SDK" version of the PDF driver as a printer, a helpful message would pop up offering to sell the customer a license for the general-purpose PDF utility. Directly, without giving us a cut. Even though we had incurred the expense of finding the customer.

Tracker never mentioned this "Trojan Horse" trick. We found out by accident. In addition, this behaviour violates anti-virus guidelines.

We switched to Amyuni PDF Creator, a much more powerful and reliable product.

PDF SDKs are usually implemented as printer drivers. Drivers occupy an intimate and privileged position in the operating system. A bug in a driver can cause more havoc than in an ordinary program. A malicious driver can cause considerable damage.

Microsoft has become more stringent about drivers over the years, changing the interface specifications, and forcing driver companies, including PDF, to overhaul their code. Microsoft now requires certification, by their labs, of all drivers. This is expensive, and naturally the cost is passed on to us in the form of renewed license fees, which can run into the thousands. Recent changes in Amyuni's licensing model have become exorbitant.

Changes in the Windows driver model break our old code, forcing our customers to upgrade. They are not all happy about this.

PDF driver installation problems, requiring arcane fixes, is one of our top support headaches.

In response to this situation, we have decided to develop code to create our own PDF files directly. This is not a trivial undertaking (the PDF spec. is 1,300 pages). But it will give us more autonomy, lower our development costs, save money for our customers, and enable us to take advantage of exciting PDF features not available through the driver interface: Table of Contents, Hyperlinks, Alphabetic Index, etc.

Our expertise with many other file formats (JPG, PNG, RTF, DXF, SVG, HTML, STL) means that our code is structured to adapt itself easily to new output formats.

We hope to have the PDF conversion completed within a couple of months.

Update: It's Nov'16, and I'm about half done.
Update 2: It's Jul'17, and I'm about three-quarter done.
Update 3: Dec'17 - Hot Dog! it's working. The new PDF does all the charts, with only a few glitches to fix. It is a thing of beauty. Bye-bye cursed driver-based solutions. A day doesn't go by that I don't get a support request from a customer whose PDF driver was zapped by a Windows update, and requires re-installation. As a bonus, Charting Companion now runs under Mac OS/X with Wine.


Monday, May 2, 2016

What is the best format for publishing your Family Tree chart?

Charting Companion offers many options for telling the story of your family.

Image (BMP, PNG, GIF, JPG, TIFF) PDF
Portable Document Format
RTF
Rich Text Format
HTML
Hyper Text Markup Language
SVG
Scalable Vector Graphics
DXF
Data eXchange Format
STL
STereo Lithography
Big wall charts Y Y Y Y
Take to a print shop Y Y Maybe
Insert in a book Y Y
Email Y Y Y Y
Publish on the Web Y Y Y
Edit with vector graphics program Y Y
3D Printing Y
Technology Raster Raster + vector Vector Vector Vector Vector Vector
Maximum size ca. 3,800 in2  
Ex: 28" x 136"
36" x 200"
80" x 150"
66" x 180"
22" 2,000" and more Depends on browser No limit No limit 8" to 10"
Depends on 3D printer

Print your family tree on a 3D printer

3D printers use melted plastic or fused resin to create objects in every shape imaginable. 3D printers are becoming popular as the technology improves and prices come down.
 
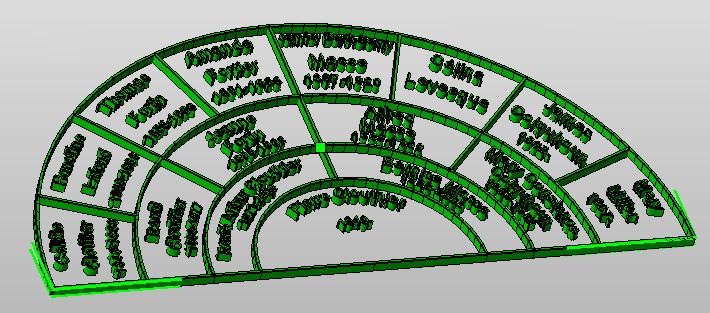
Charting Companion now includes an option to output Ancestor and Descendant Fan charts as "STL" files, which can be fed to 3D printers for printing as physical objects.
 
3D Fan chart
Preview of 3D Fan chart
 
 
3D printers range in size and price from small, desk-top units, to large industrial machines. Schools and libraries are now offering 3D printing facilities. 3Dhubs.com is a network of 3D print shops all over the World where you can email your 3D print file, and receive a fabricated piece in a few days.
 
ypical 3D printers
Typical 3D printers
 
3D printing is still in its infancy. Low-cost desktop units have a low resolution and small base plate size. Finer resolution and larger pieces require high-end, industrial-grade machines. 3D printers aimed at the consumer market are limited to three-generation Fan charts. A five-generation Fan chart is best done with 8" diameter.
 
If you haven't already upgraded, click to get the latest version of Charting Companion 6. A 3D printed family tree lasts forever, and makes a great gift idea. Share your story with your family and friends. Click for more information.
 
Charting Companion charts will make you a hit with your relatives, and the star of your next family reunion.

Ancestor chart, "Bottom-up" style

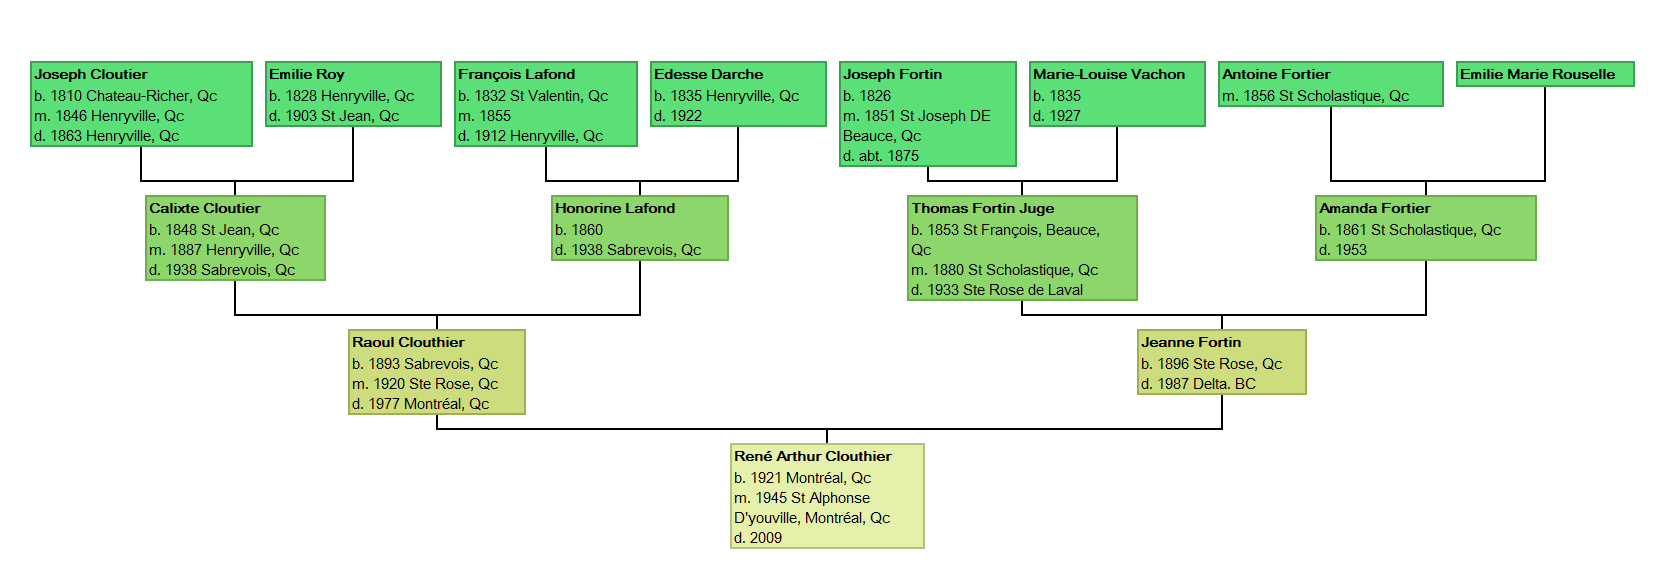
Charting Companion now prints the Ancestor chart in vertical or "Bottom-up" style.
 
Many of you have requested this option, and we are pleased to provide you with another attractive way of telling the story of your family.
 
Ancestor Bottom-up
Preview of Ancestor "Bottom-up" vertical format
 
 
Charting Companion also outputs charts in DXF format. DXF is used by all CAD (drafting) graphics software, such as AutoCAD . The DXF format allows you to edit and modify your charts using a wide range of graphics software.

New Event Type selection for Charting Companion

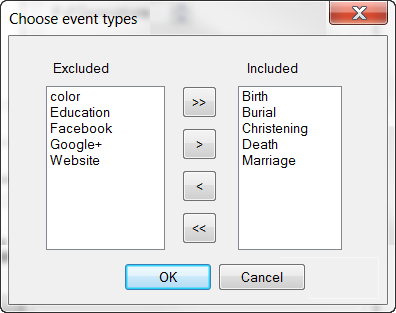
Charting Companion now allows you to pick specific event types in your Ancestor and Descendant charts.
 
Many of you have requested this option, and we are pleased to provide you with another convenient way of telling the story of your family. Get your copy of Charting Companion version 6: click to buy a Registration Key.
 
Event Type Selection
Preview of Event Type selection
 
 
You can tailor your chart by specifying the exact mix of events that you would like to see for each person. Click on the list of events in the Chart Options dialog, and the dialog above appears. Click on an event in the "Excluded" column, click on the move ">" button; the event will appear in the "Included "column, and on your chart.
 
Don't forget that you can publish your chart in HTML  format; the social media links become "clickable", to launch each person's Facebook page or Twitter feed.
 
Don't miss out on this colorful way of celebrate your family history: buy Charting Companion. We are honored to be part of your story.

Wednesday, April 20, 2016

Improving Charting Companion with GDI+

A Windows program uses GDI (Graphical Device Interface) to create graphics. GDI is a great invention that enables the programmer to easily mix text, raster (photos) and vector (drawings) graphics in the same output. GDI is what allows a Windows program to display the same thing to a screen and a printer (know as WYSIWYG, or "What you see is what you get").

GDI was introduced in 1985 with Windows 1.0. Windows XP was released in 2001 and featured GDI+, an improvement over GDI including anti-aliasing, gradients, built-in support for image files (JPG, GIF, PNG), transparency & color blending, and better display of text characters.

Antialiasing is a software technique for diminishing jaggies - stairstep-like lines that should be smooth. Jaggies occur because the output device, the monitor or printer, doesn't have a high enough resolution to represent a smooth line.

Antialiasing reduces the prominence of jaggies by surrounding the stairsteps with intermediate shades of gray (for gray-scaling devices) or color (for color devices). The pixels that surround the edges of the line are changed to varying shades of gray or color in order to blend the sharp edge into the background.

Raw vs. Antialiased vs.line


 Here is a before & after example:


Antialiasing makes smoother and better lines


 Here is what it looks like at scale:


Un-aliased & antialiased letter


  This what it looks like for text:


Antialiased text is smoother and looks better


You can see how the un-aliased text is jagged and crotchety:


We are improving Charting Companion by converting the GDI graphics to GDI+. Users will see an improvement in the quality of the text and lines. Displaying photos with GDI+ will also free us from a third-party library whose licensing model has become exorbitant.

We hope to bring you these enhancements soon, so you can tell the story of your family ever so attractively.